Pandas.DataFrameをdicts in listに変換する
dicts in listからDataFrameを作成することはよくあるが、
DataFrameをdicts in listにしたい時がたまにある。
df.to_dict('records')を実行するだけで良いのだが、
このシンプルなコードを良く忘れるのに記事にした。
入出力がまったく同じdicts in listで実施。
dicts_in_list = [{'x': random.randint(0, 10), 'y': random.randint(1, 5)} for i in range(10)]
for dil in dicts_in_list:
    print dil

df = pd.DataFrame(dicts_in_list)
print df

dicts_in_list = df.to_dict('records')
for dil in dicts_in_list:
    print dil
結果は以下の通り。
{'y': 1, 'x': 9}
{'y': 2, 'x': 7}
{'y': 3, 'x': 7}
{'y': 1, 'x': 10}
{'y': 5, 'x': 8}
{'y': 2, 'x': 1}
{'y': 5, 'x': 0}
{'y': 5, 'x': 6}
{'y': 5, 'x': 3}
{'y': 5, 'x': 7}

    x  y
0   9  1
1   7  2
2   7  3
3  10  1
4   8  5
5   1  2
6   0  5
7   6  5
8   3  5
9   7  5

{'y': 1, 'x': 9}
{'y': 2, 'x': 7}
{'y': 3, 'x': 7}
{'y': 1, 'x': 10}
{'y': 5, 'x': 8}
{'y': 2, 'x': 1}
{'y': 5, 'x': 0}
{'y': 5, 'x': 6}
{'y': 5, 'x': 3}
{'y': 5, 'x': 7}
参考文献
Pandas.DataFrameの複数カラムの同時ソート
多分100回ぐらい調べてるので、いい加減覚えるために、記事を書いてみた。 ランダム生成したxとyについて、各々降順、昇順で同時にソートする。
import pandas as pd

data = [{'x': random.randint(0, 10), 'y': random.randint(1, 5)} for i in range(10)]
df = pd.DataFrame(data)
df = df.sort(['x', 'y'], ascending=[False, True])
df.reset_index(drop=True, inplace=True)

print df
xが8,4,1の場合にソートが有効になっていることが確認できる。
    x  y
0  10  1
1   8  3
2   8  5
3   6  5
4   4  1
5   4  2
6   4  5
7   1  1
8   1  5
9   0  4
参考文献
ラベルをOneHotでエンコードする
Deep Learning、と言ってもTensorFlowしか使ったことないけど、 ラベルがnx1(nはレコード数)の行列の場合は、OneHotにエンコードする必要がある(下図)。 scikit-learnのOneHotEncoderで、一発でエンコードできるのだが、 nx1の行列をnxm(mはラベルの値の種類)に変換する処理をnumpyで行う必要があるので実装した。
# nx1 matrix
label = [4 3 0 0 1 1 1 4 3 0]

# nxm matrix
onehot_label =
[[ 0.  0.  0.  0.  1.]
 [ 0.  0.  0.  1.  0.]
 [ 1.  0.  0.  0.  0.]
 [ 1.  0.  0.  0.  0.]
 [ 0.  1.  0.  0.  0.]
 [ 0.  1.  0.  0.  0.]
 [ 0.  1.  0.  0.  0.]
 [ 0.  0.  0.  0.  1.]
 [ 0.  0.  0.  1.  0.]
 [ 1.  0.  0.  0.  0.]]
実装
numpyでreshapeとtransposeを行い、 scikit-learnでonehotにencodeする。
import numpy as np
from sklearn.preprocessing import OneHotEncoder

# generate label.
X = np.array([random.choice(range(5)) for i in range(10)])
print(X)

# reshape
X = np.array(X).reshape(1, -1)
print(X)

# transpose
X = X.transpose()
print(X)

# encode label
encoder = OneHotEncoder(n_values=max(X)+1)
X = encoder.fit_transform(X).toarray()
print(X)
各々の出力結果は以下の通り。
[2 0 0 4 3 3 4 4 2 3]

[[2 0 0 4 3 3 4 4 2 3]]

[[2]
 [0]
 [0]
 [4]
 [3]
 [3]
 [4]
 [4]
 [2]
 [3]]

[[ 0.  0.  1.  0.  0.]
 [ 1.  0.  0.  0.  0.]
 [ 1.  0.  0.  0.  0.]
 [ 0.  0.  0.  0.  1.]
 [ 0.  0.  0.  1.  0.]
 [ 0.  0.  0.  1.  0.]
 [ 0.  0.  0.  0.  1.]
 [ 0.  0.  0.  0.  1.]
 [ 0.  0.  1.  0.  0.]
 [ 0.  0.  0.  1.  0.]]
参考文献
遺伝的アルゴリズムによるOneMax問題の最適化
OneMax問題とは、[1,0,0,1,0,1,1,1,1,0]のように0/1からなる数列の和を最大化する問題のこと。 答えはすべて1の数列と自明だが、これを最適化アルゴリズムの1つである遺伝的アルゴリズムで解く。 遺伝的アルゴリズムとは、このような数列を遺伝子と見立て複数生成し、 数世代に渡り交叉と突然変異を繰り返すことにより、優秀な遺伝子を生み出すアルゴリズムのこと。 ここでの優秀の定義は「数列の和が大きい」となる。
PythonではDEAPという 遺伝的アルゴリズムのライブラリーがあるが、個人的に拡張性が低くて使いにくかったのと、 実装がそれほど難しくはないので、Pythonでスクラッチから書くことにした。
アルゴリズムの流れ
- 第1世代の個体群の生成
- エリートの選択
- エリートの交叉/突然変異
- 次世代の個体群の生成
- 2〜4の操作を繰り返し、適応度の最も高い個体を解として出力
簡単な流れは上記の通り。 各世代の個体群の数は固定で、現世代のエリートと、彼らの子供の和となる。
1. 第1世代の個体群の生成
第2世代以降の個体群の生成は、基本的に交叉か突然変異になる。 そのため、この操作は第1世代だけ必要になる。 ランダム選択した0/1がN_PARAM個並ぶ数列を、 N_POP個生成する。
    def get_population(self):
        population = []
        for i in range(N_POP):
            arr = [random.randint(0,1) for j in range(N_PARAM)]
            population.append(arr)

        return population
各個体は後ほど適応度を計算するが、まず-1で初期化しておく。
>>> pop = [(-1, p) for p in self.get_population()]
>>> pop
[
    (-1, [0, 0, 0, 0, 1, 1, 1, 1, 0, 0]),
    (-1, [1, 0, 1, 0, 1, 0, 0, 1, 0, 0]),
    (-1, [1, 0, 0, 0, 1, 0, 0, 0, 0, 1]),
    ...
]
2. エリートの選択
evaluateメソッドで、個体の適応度(fitness)を計算している。 OneMaxにおける適応度はリストの和とシンプルだが、今後の拡張を考えてメソッド化(clac_score)しておく。
    def clac_score(self, x):
        return sum(x)


    def evaluate(self, pop):
        fitness = []
        for p in pop:
            if p[0] == -1:
                fitness.append((self.clac_score(p[1]), p[1]))
            else:
                fitness.append(p)
        fitness.sort()
        fitness.reverse()

        return fitness
全個体の適応度を計算してソートしたら、ELITE_RATEの割合でエリートとして選択する。
>>> fitness = self.evaluate(pop)
>>> elites = fitness[:int(len(pop)*ELITE_RATE)]
3. エリートの交叉/突然変異
突然変異mutate()では、個体の数列からパラメーターを1つだけ反転させる。
交叉crossover()では、片親の遺伝子の一部を切り取り、もう片親の同じ位置にペーストする。
これを2点交叉というが、場合によっては1点交叉にもなり得る。
    def mutate(self, parent):
        r = int(math.floor(random.random()*len(parent)))
        child = copy.deepcopy(parent)
        child[r] = (parent[r]+1) % 2

        return child


    def crossover(self, parent1, parent2):
        length = len(parent1)
        r1 = int(math.floor(random.random()*length))
        r2 = r1 + int(math.floor(random.random()*(length-r1)))

        child = copy.deepcopy(parent1)
        child[r1:r2] = parent2[r1:r2]

        return child
突然変異はMUTATE_BROPの確率で起こり、それ以外は交叉となる。 これを全ての個体に対して行う。個体の組合せはランダムである。
pop = elites[:]
while len(pop) < N_POP:
    if random.random() < MUTATE_PROB:
        m = random.randint(0, len(elites)-1)
        child = self.mutate(elites[m][1])
    else:
        c1 = random.randint(0, len(elites)-1)
        c2 = random.randint(0, len(elites)-1)
        child = self.crossover(elites[c1][1], elites[c2][1])
    pop.append((-1, child))
4. 次世代の個体群の生成
現世代のエリートを選択し、彼らを交叉/突然変異させた個体群を生成した。 これらの適応度を計算することで、次世代の個体群が生成される。
fitness = self.evaluate(pop)
pop = fitness[:]
結果
10個の0/1の数列のOneMax問題を解かせたところ、第4世代で最適解が得られた。
Generation: 0
(8, [1, 1, 1, 1, 1, 1, 1, 0, 0, 1])

Generation: 1
(9, [1, 1, 1, 1, 1, 1, 1, 1, 0, 1])

Generation: 2
(9, [1, 1, 1, 1, 1, 1, 1, 1, 0, 1])

Generation: 3
(10, [1, 1, 1, 1, 1, 1, 1, 1, 1, 1])

...

Generation: 24
(10, [1, 1, 1, 1, 1, 1, 1, 1, 1, 1])
ソースコード
全ソースコードを以下に載せておく。1ファイルにまとまっている。$ python ga.pyで実行可能。
# coding: utf-8

import random
import math
import copy

N_PARAM = 10
N_POP = 20
N_GEN = 25
MUTATE_PROB = 0.1
ELITE_RATE = 0.2

class GA:
    def __init__(self):
        pass


    def main(self):
        pop = [(-1, p) for p in self.get_population()]

        for g in range(N_GEN):
            print 'Generation: ' + str(g)

            # Get elites
            fitness = self.evaluate(pop)
            elites = fitness[:int(len(pop)*ELITE_RATE)]

            # Cross and mutate
            pop = elites[:]
            while len(pop) < N_POP:
                if random.random() < MUTATE_PROB:
                    m = random.randint(0, len(elites)-1)
                    child = self.mutate(elites[m][1])
                else:
                    c1 = random.randint(0, len(elites)-1)
                    c2 = random.randint(0, len(elites)-1)
                    child = self.crossover(elites[c1][1], elites[c2][1])
                pop.append((-1, child))

            # Evaluate indivisual
            fitness = self.evaluate(pop)
            pop = fitness[:]

            print pop[0]
            print


    def get_population(self):
        population = []
        for i in range(N_POP):
            arr = [random.randint(0,1) for j in range(N_PARAM)]
            population.append(arr)

        return population


    def clac_score(self, x):
        return sum(x)


    def evaluate(self, pop):
        fitness = []
        for p in pop:
            if p[0] == -1:
                fitness.append((self.clac_score(p[1]), p[1]))
            else:
                fitness.append(p)
        fitness.sort()
        fitness.reverse()

        return fitness


    def mutate(self, parent):
        r = int(math.floor(random.random()*len(parent)))
        child = copy.deepcopy(parent)
        child[r] = (parent[r]+1) % 2

        return child


    def crossover(self, parent1, parent2):
        length = len(parent1)
        r1 = int(math.floor(random.random()*length))
        r2 = r1 + int(math.floor(random.random()*(length-r1)))

        child = copy.deepcopy(parent1)
        child[r1:r2] = parent2[r1:r2]

        return child


if __name__ == "__main__":
    GA().main()
参考文献
DeepLearningの学習曲線をmatplotlibで可視化
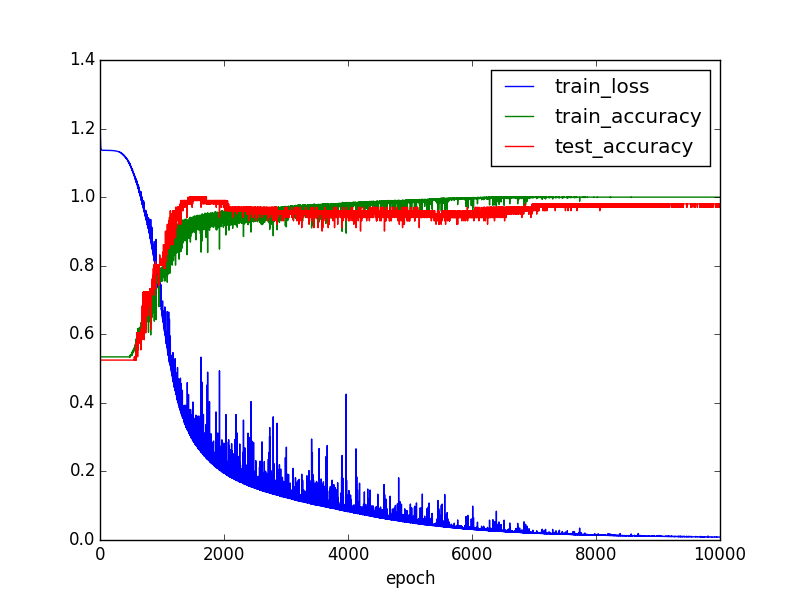
TensorBoardのEventsによる学習状況の可視化 を行ったが、今後いろいろとカスタマイズしたくなると思い、matplotlibで可視化することにした。 今回もFizzBuzz問題を例に扱う。詳しくは、Deep Learning入門としてのFizzBuzz問題を参照。
精度とコストの記録
学習過程(train_network())で、エポックごとにtrain_loss、train_accuracy、test_accuracyを算出して記録する。
記録はCSV形式で保存する。# Loggingと# Save logsがそれらの操作にあたる。
    def train_network(self, data, network):
        # data
        train_data  = data[0]
        train_label = data[1]
        test_data  = data[2]
        test_label = data[3]

        # model
        X  = network['X']
        Y  = network['Y']
        Y_ = network['Y_']
        loss  = network['loss']
        step  = network['step']

        # Setting
        sess = tf.InteractiveSession()
        tf.initialize_all_variables().run()
        accuracy = tf.reduce_mean(tf.cast(tf.equal(tf.argmax(Y, 1), tf.argmax(Y_, 1)), tf.float32))

        logs = []
        for epoch in range(N_ITER+1):
            # Randamize data
            p = np.random.permutation(range(len(train_data)))
            train_data, train_label = train_data[p], train_label[p]

            # Training
            for start in range(0, train_label.shape[0], BATCH_SIZE):
                end = start + BATCH_SIZE
                sess.run(step, feed_dict={X: train_data[start:end], Y_: train_label[start:end]})

            # Testing
            train_loss = sess.run(loss, feed_dict={X: train_data, Y_: train_label})
            train_accuracy = sess.run(accuracy, feed_dict={X: train_data, Y_: train_label})
            test_accuracy = sess.run(accuracy, feed_dict={X: test_data, Y_: test_label})

            # Logging
            log = {'epoch': epoch, 'train_loss': train_loss, 'train_accuracy': train_accuracy, 'test_accuracy': test_accuracy}
            logs.append(log)

            if epoch % 100 == 0:
                std_output = 'Epoch: %s, \t Train Loss: %s, \t Train Accuracy: %s, \t Test Accuracy: %s'
                print(std_output % (log['epoch'], log['train_loss'], log['train_accuracy'], log['test_accuracy']))

        # Save logs
        df = pd.DataFrame(logs)
        df.to_csv("./log/acculoss_train_%s_batch_%s_iter_%s.csv" % (TRAIN_RATE, BATCH_SIZE, N_ITER), index=False)
CSVファイルは以下のようになる。
epoch,test_accuracy,train_accuracy,train_loss
0,0.5247524976730347,0.5341278314590454,1.3275593519210815
1,0.5247524976730347,0.5341278314590454,1.284529209136963
2,0.5247524976730347,0.5341278314590454,1.2487729787826538
...
9998,0.9801980257034302,1.0,0.008503337390720844
9999,0.9801980257034302,1.0,0.008444004692137241
10000,0.9801980257034302,1.0,0.008517774753272533
可視化
保存したCSVファイルを読み込んで、精度とコストの値をセットして、 背景色がグレーなのが気に入らないのでホワイトにして、各曲線にラベルを付けて、可視化を行う。
    def main(self):
        # Read file
        df = pd.read_csv('./log/acculoss_train_0.05_batch_100_iter_10000.csv')

        # Set values
        x = df['epoch'].values
        y0 = df['train_loss'].values
        y1 = df['train_accuracy'].values
        y2 = df['test_accuracy'].values

        # Set background color to white
        fig = plt.figure()
        fig.patch.set_facecolor('white')

        # Plot lines
        plt.xlabel('epoch')
        plt.plot(x, y0, label='train_loss')
        plt.plot(x, y1, label='train_accuracy')
        plt.plot(x, y2, label='test_accuracy')
        plt.legend()

        # Visualize
        plt.show()
可視化すると以下のようになる。
train_accuracyとtrain_lossだけを見ると上手くいってるように見えるが、
test_accuracyを見ると過学習しているのが分かる。

ちなみに最終結果は、以下の通り、まあまあの精度。
| Epoch | Train Loss | Train Accuracy | Test Accuracy |
|---|---|---|---|
| 10000 | 0.00851777 | 1.0 | 0.980198 |
TensorBoardのEventsによる学習状況の可視化
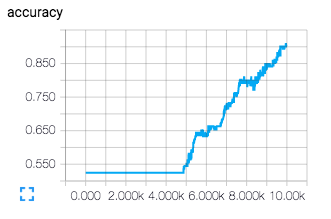
TensorFlowに学習状況を可視化するTensorBoardというツールがあるのだが、 コスト関数と精度を可視化してみたかったので使ってみた。
実装
Deep Learning入門としてのFizzBuzz問題
のモデル学習のメソッドをベースにしている。
コメント# Logging data for TensorBoardと# Write log to TensorBoardの直下のコードがTensorBoardを利用する部分のコード。
def train_model(self, data, model):
    # dataのセット
    train_X = data[0]
    train_Y = data[1]
    test_X = data[2]
    test_Y = data[3]

    # modelのセット
    X = model['X']
    Y = model['Y']
    Y_ = model['Y_']
    loss = model['loss']
    train_step = model['train_step']

    # 定義
    accuracy = tf.reduce_mean(tf.cast(tf.equal(tf.argmax(Y, 1), tf.argmax(Y_, 1)), tf.float32))

    # 初期化
    sess = tf.InteractiveSession()
    tf.initialize_all_variables().run()

    # Logging data for TensorBoard
    _ = tf.scalar_summary('loss', loss)
    _ = tf.scalar_summary('accuracy', accuracy)
    writer = tf.train.SummaryWriter('./log/', graph_def=sess.graph_def)

    for epoch in range(10000+1):
        # データのランダマイズ
        p = np.random.permutation(range(len(train_X)))
        train_X, train_Y = train_X[p], train_Y[p]

        # 学習
        for start in range(0, train_X.shape[0], 100):
            end = start + 100
            sess.run(train_step, feed_dict={X: train_X[start:end], Y_: train_Y[start:end]})

        # テスト
        if epoch % 100 == 0:
            # 教師データのコスト関数
            loss_train = sess.run(loss, feed_dict={X: train_X, Y_: train_Y})
            # 教師データの精度
            accu_train = sess.run(accuracy, feed_dict={X: train_X, Y_: train_Y})
            # テストデータのコスト関数
            loss_test = sess.run(loss, feed_dict={X: test_X, Y_: test_Y})
            # テストデータの精度
            accu_test = sess.run(accuracy, feed_dict={X: test_X, Y_: test_Y})
            # 標準出力
            std_output = 'Epoch: %s, \t Train Loss: %s, \t Train Accracy: %s, \t Test Loss: %s, \t Test Accracy: %s'
            print std_output % (epoch, round(loss_train, 6), round(accu_train, 6), round(loss_test, 6), round(accu_test, 6))

        # Write log to TensorBoard
        summary_str = sess.run(tf.merge_all_summaries(), feed_dict={X: test_X, Y_: test_Y})
        writer.add_summary(summary_str, epoch)
解説
コスト関数は引数として渡される。 実装はコメントの通り。
# loss = tf.reduce_mean(tf.nn.softmax_cross_entropy_with_logits(Y, Y_))
loss = model['loss']
精度は以下の通り。 詳しい実装内容はこちらを参照。
accuracy = tf.reduce_mean(tf.cast(tf.equal(tf.argmax(Y, 1), tf.argmax(Y_, 1)), tf.float32))
ここからが、TensorBoardの実装部分。 1、2行目は可視化したいコスト関数と精度の変数を出力名と共に、tf.scalar_summary()に渡している。 3行目は出力先を指定している。
# Logging data for TensorBoard
_ = tf.scalar_summary('loss', loss)
_ = tf.scalar_summary('accuracy', accuracy)
writer = tf.train.SummaryWriter('./log/', graph_def=sess.graph_def)
tf.merge_all_summaries()は上記で設定した_(コスト関数と精度)を指す。
これらにfeed_dictに指定したテストデータとテストラベルを渡して、結果をTensorBoardに出力する。
出力間隔はepochとしたので、for文の中で定義している。
for epoch in range(10000+1):

    ...

    # Write log to TensorBoard
    summary_str = sess.run(tf.merge_all_summaries(), feed_dict={X: test_X, Y_: test_Y})
    writer.add_summary(summary_str, epoch)
学習終了したら、別ターミナルで以下のコードを実行すると、 http://0.0.0.0:6006からTensorBoardを見ることができる。 ただし、1行目はvirtualenvの場合のみ実行。
$ source ~/tensorflow/bin/activate
(tensorflow) $ python ~/tensorflow/lib/python2.7/site-packages/tensorflow/tensorboard/tensorboard.py --logdir=./log/
Starting TensorBoard 16 on port 6006
(You can navigate to http://0.0.0.0:6006)
結果
次のように可視化される。 accuracyがサッチってないので、バッチ数などのパラメーターを変えるか、epoch数を増やす必要があることが分かる。


参考文献
Deep Learning入門としてのFizzBuzz問題
FizzBuzz問題とは何か。 こちらから引用させてもらう。
Fizz-Buzz問題の例はこんな感じだ。
1から100までの数をプリントするプログラムを書け。ただし3の倍数のときは数の代わりに「Fizz」と、5の倍数のときは「Buzz」とプリントし、3と5両方の倍数の場合には「FizzBuzz」とプリントすること。
ちゃんとしたプログラマであれば、これを実行するプログラムを2分とかからずに紙に書き出せるはずだ。怖い事実を聞きたい? コンピュータサイエンス学科卒業生の過半数にはそれができないのだ。自称上級プログラマが答えを書くのに10-15分もかかっているのを見たこともある。
これをDeep Learningで学習したモデルに行わせる。 なぜDeep Learning入門用ベンチマークかと言うと、 教師データの101〜1023とテストデータの0〜100の作成コードが、ラベリングも含めて簡単に実装できるし、 モデルの設計も隠れ層が1つとシンプルなので速く収束し、そこそこ高い精度が出せるから。 データ作成とDeep Learningの実装はTensorFlowコトハジメ Fizz-Buzz問題が詳しい。 以下では同様にTensorFlowを使っているが、実装やパラメーターが異なるし、説明は先のリンクの方が丁寧である。 FizzBuzz問題、DeepLearning、TensorFlowについて、すべて詳しくない方はこちらの記事を読んでおくことをお勧めする。
フロー
main関数の3ステップがフローとなる。
class DLFizzBuzz:
    def main(self):
        # 1. FizzBuzzデータを生成して取得する。
        data = DataFizzBuzz().main()

        # 2. Deep Learnigモデルを設計する。
        model = self.design_model(data)

        # 3. Deep Learningモデルを学習させる。
        self.train_model(data, model)
データ生成
生成コードは以下の通り。 main()を呼び出すと教師データ、教師ラベル、テストデータ、テストラベルをリストで取得できる。
BORDER = 101
NUM_DIGITS = 10

class DataFizzBuzz:
    def main(self):
        # Train
        train_data = np.array([self.binary_encode(i, NUM_DIGITS) for i in range(BORDER, 2**NUM_DIGITS)])
        train_label = np.array([self.fizz_buzz_encode(i) for i in range(BORDER, 2**NUM_DIGITS)])

        # Test
        test_data = np.array([self.binary_encode(i, NUM_DIGITS) for i in range(0, BORDER)])
        test_label = np.array([self.fizz_buzz_encode(i) for i in range(0, BORDER)])

        # Collect
        data = [train_data, train_label, test_data, test_label]

        return data


    def binary_encode(self, i, num_digit):
        binary = np.array([i >> d & 1 for d in range(NUM_DIGITS)])

        return binary


    def fizz_buzz_encode(self, i):
        if i % 15 == 0:
            result = np.array([0, 0, 0, 1])
        elif i % 5 == 0:
            result = np.array([0, 0, 1, 0])
        elif i % 3 == 0:
            result = np.array([0, 1, 0, 0])
        else:
            result = np.array([1, 0, 0, 0])

        return result
モデル設計
教師データは101〜1023なので、range(101, 210)となり、2進数で10桁に収まる。 またテストデータは0〜100だが、とりあえずFizz/Buzz/FizzBuzz/その他が区別できればよいので、4次元ベクトルで表現できる。 そのためノード数は、入力層が10、出力層が4となる。 また隠れ層を100とした場合、モデルの設計は以下のようになる。 なお、重み、バイアス、学習関数等は初歩的なものを用いている。
def design_model(self, data):
    # 入力層
    X  = tf.placeholder(tf.float32, [None, data[0].shape[1]])

    # 隠れ層
    W1 = tf.Variable(tf.random_normal([data[0].shape[1], 100], stddev=0.01))
    B1 = tf.Variable(tf.zeros([100]))
    H1 = tf.nn.relu(tf.matmul(X, W1) + B1)

    # 出力層
    W2 = tf.Variable(tf.random_normal([100, data[1].shape[1]], stddev=0.01))
    B2 = tf.Variable(tf.zeros([data[1].shape[1]]))
    Y = tf.matmul(H1, W2) + B2

    # 正解
    Y_ = tf.placeholder(tf.float32, [None, data[1].shape[1]])

    # 学習関数
    loss = tf.reduce_mean(tf.nn.softmax_cross_entropy_with_logits(Y, Y_))
    train_step = tf.train.GradientDescentOptimizer(0.01).minimize(loss)

    model = {'X': X, 'Y': Y, 'Y_': Y_, 'loss': loss, 'train_step': train_step}

    return model
モデル学習
まずデータとモデルを引数として渡し、変数にセットする。
def train_model(self, data, model):
    # dataのセット
    train_X = data[0]
    train_Y = data[1]
    test_X = data[2]
    test_Y = data[3]

    # modelのセット
    X = model['X']
    Y = model['Y']
    Y_ = model['Y_']
    loss = model['loss']
    train_step = model['train_step']
学習中、定期的に精度を検証する。 以下の1行についてはTensorFlowによる精度計算の流れを追うで解説している。
    # 定義
    accuracy = tf.reduce_mean(tf.cast(tf.equal(tf.argmax(Y, 1), tf.argmax(Y_, 1)), tf.float32))
教師データは101〜1023の923レコードあり、これらをランダマイズして、10レコードずつ学習させる。 この過程を1エポックとして10000回行う。 また100エポックごとにテストを行い、コスト、教師データの精度、テストデータの精度を算出して標準出力させる。
    # 初期化
    sess = tf.InteractiveSession()
    tf.initialize_all_variables().run()

    for epoch in range(10000+1):
        # データのランダマイズ
        p = np.random.permutation(range(len(train_X)))
        train_X, train_Y = train_X[p], train_Y[p]

        # 学習
        for start in range(0, train_X.shape[0], 10):
            end = start + 10
            sess.run(train_step, feed_dict={X: train_X[start:end], Y_: train_Y[start:end]})

        # テスト
        if epoch % 100 == 0:
            # コスト
            lo55 = sess.run(loss, feed_dict={X: train_X, Y_: train_Y})
            # 教師データの精度
            accu_train = sess.run(accuracy, feed_dict={X: train_X, Y_: train_Y})
            # テストデータの精度
            accu_test = sess.run(accuracy, feed_dict={X: test_X, Y_: test_Y})
            # 標準出力
            print 'Epoch: %s, \t Loss: %-8s, \t Train Accracy: %-8s, \t Test Accracy: %-8s' % (epoch, lo55, accu_train, accu_test)
結果と課題
最終的に、コストが0.002、教師データの精度が100%、テストデータの精度が95%となった。 初期の段階では、教師データの精度が94%にも関わらず、テストデータの精度が100%になったが、 その後、過学習が起こり精度が逆転した。 今後はDropoutを実装して過学習を防いだり、パラメーターの最適化を行う。 あと学習曲線も表示させる。